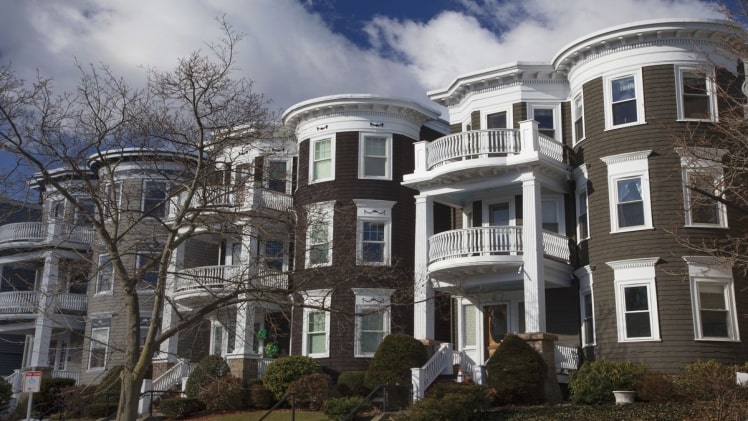
The neighborhood of South Boston is the pride of Beantown in more ways than one. Not only is it an iconic neighborhood steeped in rich history, its housing market has been one of the rising stars of the past decade. It is the dream of many local investors to own an investment property in South Boston, but with real estate prices as high as they are, profitability may seem out of reach.
If you think the ship has sailed on investment properties in South Boston, think again. There are some opportunities for profitable investments if you know what type of properties to look out for. In this article, we’ll analyze the estimated NOI for different types of homes for sale in South Boston. We are calculating NOI expenses based on a standard loan and the median sales price for each type of property. We’re also deducting yearly standard operating expenses (property taxes, homeowner’s insurance and maintenance). Annual operating income is based on the average rent price for apartments in South Boston multiplied by 12.
Visit this site: telugu songs download
South Boston NOI By Property Type
If you estimate the NOI based on the 1 year median price for both single family homes and condos in South Boston, you’ll see a sizable loss in NOI for both. South Boston condos tend to yield a smaller yearly loss in operating income compared to single family homes, but both fall in the red by -$7,129 and -$12,360 respectively.
| South Boston | Avg. Rent x 12 | Estimated Annual Expenses | NOI |
| South Boston SF | $34,476 | -$46,836 | -$12,360 |
| South Boston Condo | $34,476 | -$41,605 | -$7,129 |
It’s important to keep in mind that these are averages based on median sales prices, and each property for sale presents its own unique opportunity. Just because the area’s average NOI is negative does not mean there are no profitable properties in that area. In fact, in regards to South Boston specifically, there are plenty of properties for sale that will yield a positive NOI for investors in both categories, you just have to know where to look. One way to illustrate this is by calculating the NOI by property size.
South Boston NOI by Property Size
If we apply the same formula to the median sales prices of each property size, we find a few areas of opportunity for South Boston real estate investors. All of these calculations factor in the appropriate average rent price for each size unit as well. While studios, 2 bedroom, and 3 bedroom properties all yield sizable losses in yearly NOI, 1 and 5 bedroom properties have NOIs within $300 of breaking even. In fact, 5 bedroom properties yield a +$122 NOI based on the current median sales price.
| South Boston | Avg. Rent x 12 | Estimated Annual Expenses | NOI |
| South Boston Studio | $20,064 | -$27,872 | -$7,808 |
| South Boston 1BR | $26,616 | -$26,917 | -$301 |
| South Boston 2BR | $34,188 | -$37,588 | -$3,400 |
| South Boston 3BR | $42,624 | -$49,972 | -$7,348 |
| South Boston 4BR | $55,428 | -$56,819 | -$1,391 |
| South Boston 5BR | $74,316 | -$74,194 | $122 |
Now the data paints a more optimistic picture for South Boston investors. If you look for 1 bedroom properties or larger 4 and 5 bedroom properties as potential investments in Southie, you’ll likely find more properties with the potential of positive NOI.
Read More About: naasongs